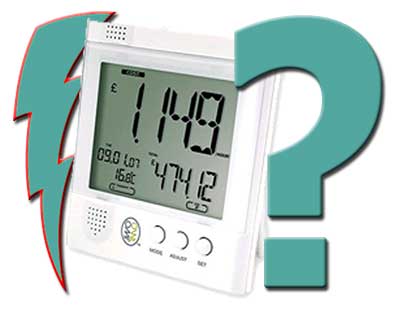
2008 may be remembered as the year that the rest of us finally started to take an interest in reducing our energy consumption.
But to be able to reduce your energy bills, first you need to be able to measure your consumption . Many of us only get an idea of our energy usage once a quarter when our bills arrive, or worse still, once a year when the electricity company adjust their direct debit amount
While many modern cars will give you feedback on your current driving style in the form of an instant MPG (Miles per Gallon) figure, very few homes can report on their cost per hour to run. Thankfully help is at hand as there are now a range of devices to help the home owner monitor their electricity usage, here are a few of the best.
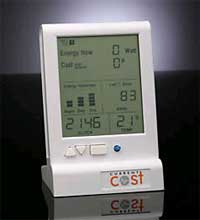 The Current Cost system is the most popular device with home automators at present. It’s relatively inexpensive at around £45 and fitting is simply a matter of placing the clamp sensor around the appropriate cable in your meter box. The receiver then obtains the results wirelessly (max range ~30 metres). The system supports multiple clamps and multiple receivers too for 3-phase system or those employing wind turbines etc in addition to the mains. It also supports multiple receivers if you wish to view the information in another room.
Its trump card however is its ability to output its data to a PC via the optional cable. As well as historical data being available on your local LAN, it can be published to public or private webpages too
An interesting service called Panchube already has users feeding their data into their system and producing pretty graphs of their power usage. Here’s a page detailing how to do this with the current cost unit. And here’s another little gem there on adding a System Tray icon in Windows to show your home’s current energy usage.
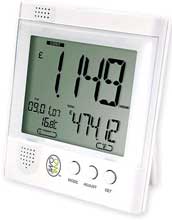 The Owl is a similar device that also uses a clamp at your meter to measure power consumption. At under £30 its very affordable and has recently undergone an update. Although it still can’t be connected to a computer it now has a “cumulative memory” feature – “Building on the success of original OWL, new features include:
- A cumulative function that lets you see your cost accumulate over any period you choose, be it daily, weekly, monthly, quarterly or on an annual basis. You can then start to track changes over time which allows you to fine tune your energy saving strategy in an even better way than before.
- The new multiple tariff function means you can set your OWL to factor in a range of tariffs (Economy 7, Night-time etc) to create an even more accurate picture of your usage.
- A much improved battery life now gives greater than 12 months usage with the batteries supplied.”
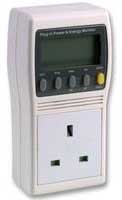 One of the most in-expensive ways to start measuring is with a device like the Plug-in Energy Monitor . For around £10 you can simply plug it into the wall, then plug any device into it and see just how much power it’s using.
Try your PC for example, you may be surprised at just how much power it uses and in many cases it’ll still be using power even when its switched off!
With a little experimenting you can find the worst culprits and manage them more Efficientl.
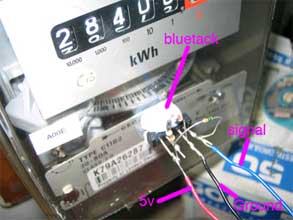
Meter Hack – If you’re a true geek then you may like to try This Hack to read data directly from your electricity meter. A few components soldered together can detect each time the wheel inside the meter completes a revolution. Once this information is available it’s a simple calculation to work out how much power is being used at any point in time.
While you’re considering you own energy requirement, have a read of this very interesting article on the demands on the national grid. This came from a talk at the recent HomeCamp unconference and has this interesting nugget –
“…the signal that indicates the current ratio of supply/demand on the grid is available at every plug socket in the country: the AC frequency. 50Hz is nominal, but it actually varies by 0.1-0.2Hz on a regular basis. If there is over supply on the grid, the frequency will increase, and obviously visa-versa.”
This gives the possibility of future appliances (like a fridge for example) that could detect the demand on the grid and disconnect themselves periodically to help reduce the strain. Other smart appliance (think dish washer) could be triggered to start off during off peak periods for financial incentives for the home owner.
Check out the Real Time Graphs available from the Nation Grid site (a panchube page has been setup for these too).
Save the Cheerleader, Save the World – No longer do you have to be an raving environmentalists to want to reduce your consumption. It just makes good financial sense, especially in the present world economic crisis, to monitor and reduce your power consumption, and you can feel warm and fuzzy as you do your bit to help save the planet at the same time. We also need to measure our other utilities like water and gas in the same way, bringing the data all together in a way that’s easy to monitor and act upon. We need to be able to see the effects of turning gas fueled central heating system down a degree for example, in the same way the devices above can show the effect of moving your home to compact fluorescent or LED energy saving light bulbs.
Of course monitoring is only the start, having your home act autonomously upon the information received is the other side of the loop. If ever Home Automation had a legitimate use, then this is surely it.
CurrentCost.com (Available to buy HERE)
TheOwl.com (Available to buy HERE)
Buy an Energy Meter from Amazon
Want More? – Follow us on Twitter, Like us on Facebook, or subscribe to our RSS feed. You can even get these news stories delivered via email, straight to your inbox every day

Some other software I found after email the guys.
http://code.google.com/p/currentcostgui/
http://currentcost.appspot.com/static/welcome.html
And here’s a link to a cross-platform application that connects CurrentCost directly to Pachube, with no requirement for hacking! http://community.pachube.com/?q=node/100
(By the way the article calls it “panchube” but I think it’s actually “pachube”, no “n” in there!)